In designing the NVI, we had to answer the question: What geographic area is the right size? To answer this question, we convened the Defining Neighborhoods task force from our broad spectrum of partners. Their challenge was to create geographic areas within Detroit that were small enough to provide actionable data for community-based organizations, but large enough to protect individual privacy and give us a reasonable target for collecting a citywide survey. For privacy reasons, we never report data for individual names or home addresses. Instead, we report data for geographic areas that combine or "aggregate" all of the responses from that area.
Learning about Detroit by talking to every single resident is impossible. The Census Bureau tries to do this every ten years with the Decennial Census, at enormous cost. We don’t have the resources of the Census Bureau, but luckily, we can use math to figure out how many Detroiters we need to talk to in any geographic area to get a general idea of what the larger population thinks. But we had another problem: Detroit’s council districts are too big for their data to be useful at a neighborhood level, and most of Detroit’s neighborhoods are too small for data collection to be practical. To fix this, the group that created the NVI came up with “neighborhood zones.” These zones help us ensure data accuracy, privacy, and utility. In this post, we’ll explain how these zones came to be and why they help NVI provide better information.
Detroit neighborhoods vary a lot in what we call population density, meaning that some areas have a lot more people living close together, while other areas have fewer people living farther apart. Since so many neighborhoods are small or have lower population density, it would have been too time consuming and expensive to survey enough people to create estimates at the neighborhood level (we would have had to collect over 60,000 survey responses!) An obvious solution was to utilize City Council Districts; however, residents and community organizations we spoke with knew that these districts were too large to provide them with useful information. So, we worked with Building the Engine of Community Development in Detroit’s Defining Neighborhoods Task Force to create the NVI Neighborhood Zones to provide data at a small enough geography to be useful while also maintaining a large enough population for effective data collection. With zones, the number of survey responses we need to collect across the city is closer to 6,000—still a large number, but much more doable than 60,000.
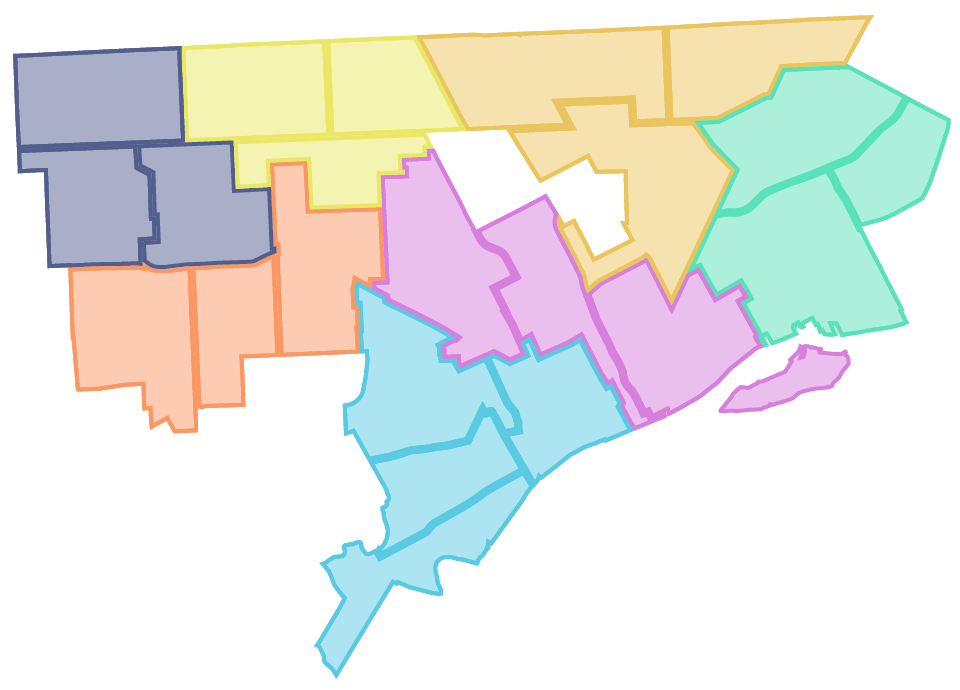
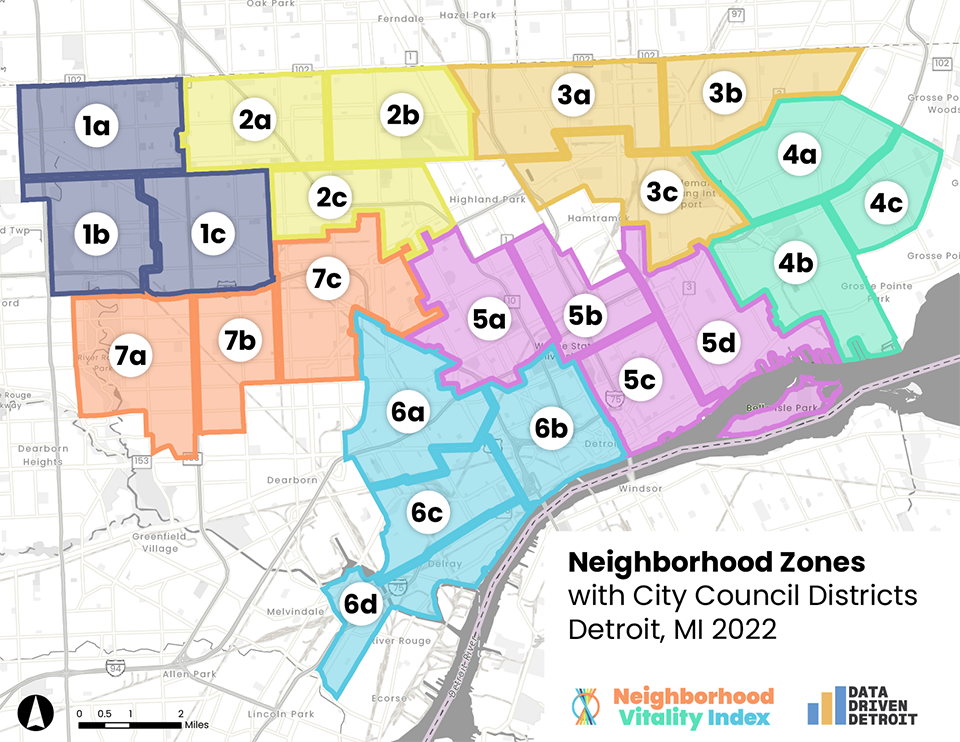
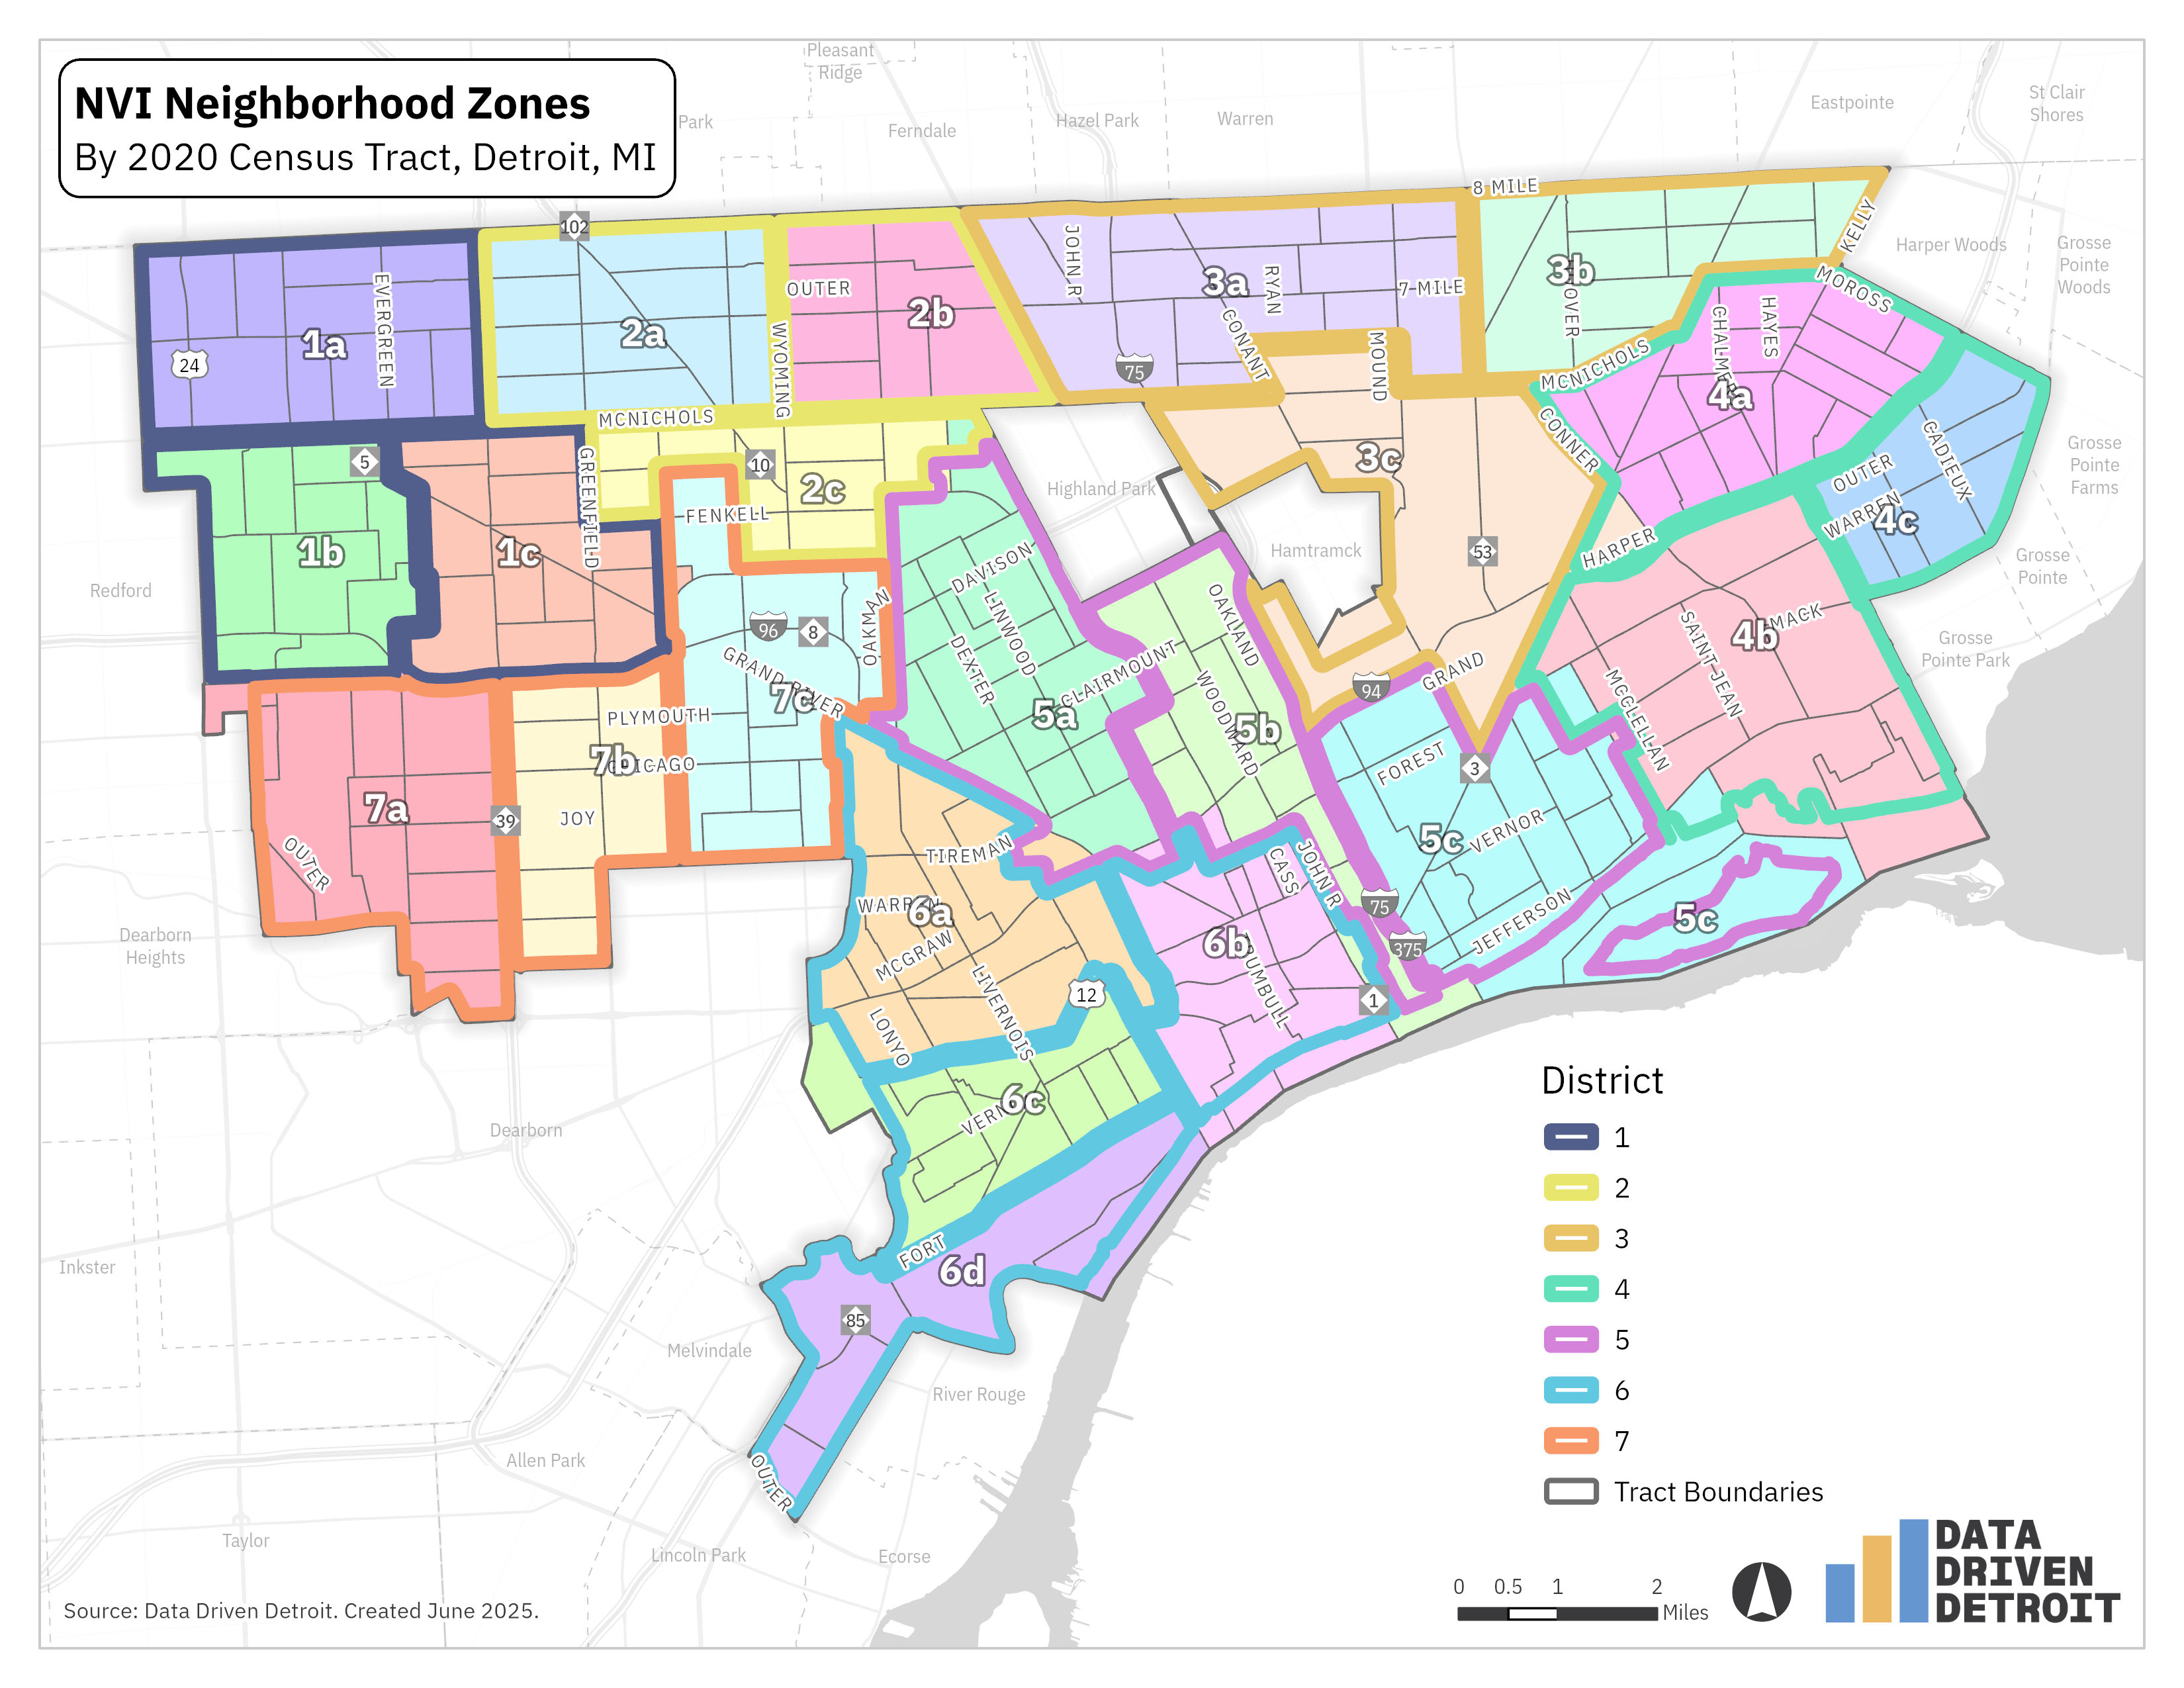
The Defining Neighborhoods Task Force came up with a strategy that balanced data integrity with the authenticity of those boundaries. Using neighborhood boundaries as identified by Detroit’s Department of Neighborhoods as a starting point, the group divided each Council District into 3-4 geographic areas. These zones are each identified by a number and a letter, so, for example, Neighborhood Zone 3a is a zone located in Council District 3. Wherever possible, zones were drawn to keep similar neighborhoods together.
The only constant about working with data is that nothing stays the same. Numbers change, places change, and sometimes even the ways that we measure things change. And this is no less true for the geographies that we use to report out data and information. We now find ourselves in the midst of one of these rounds of change.
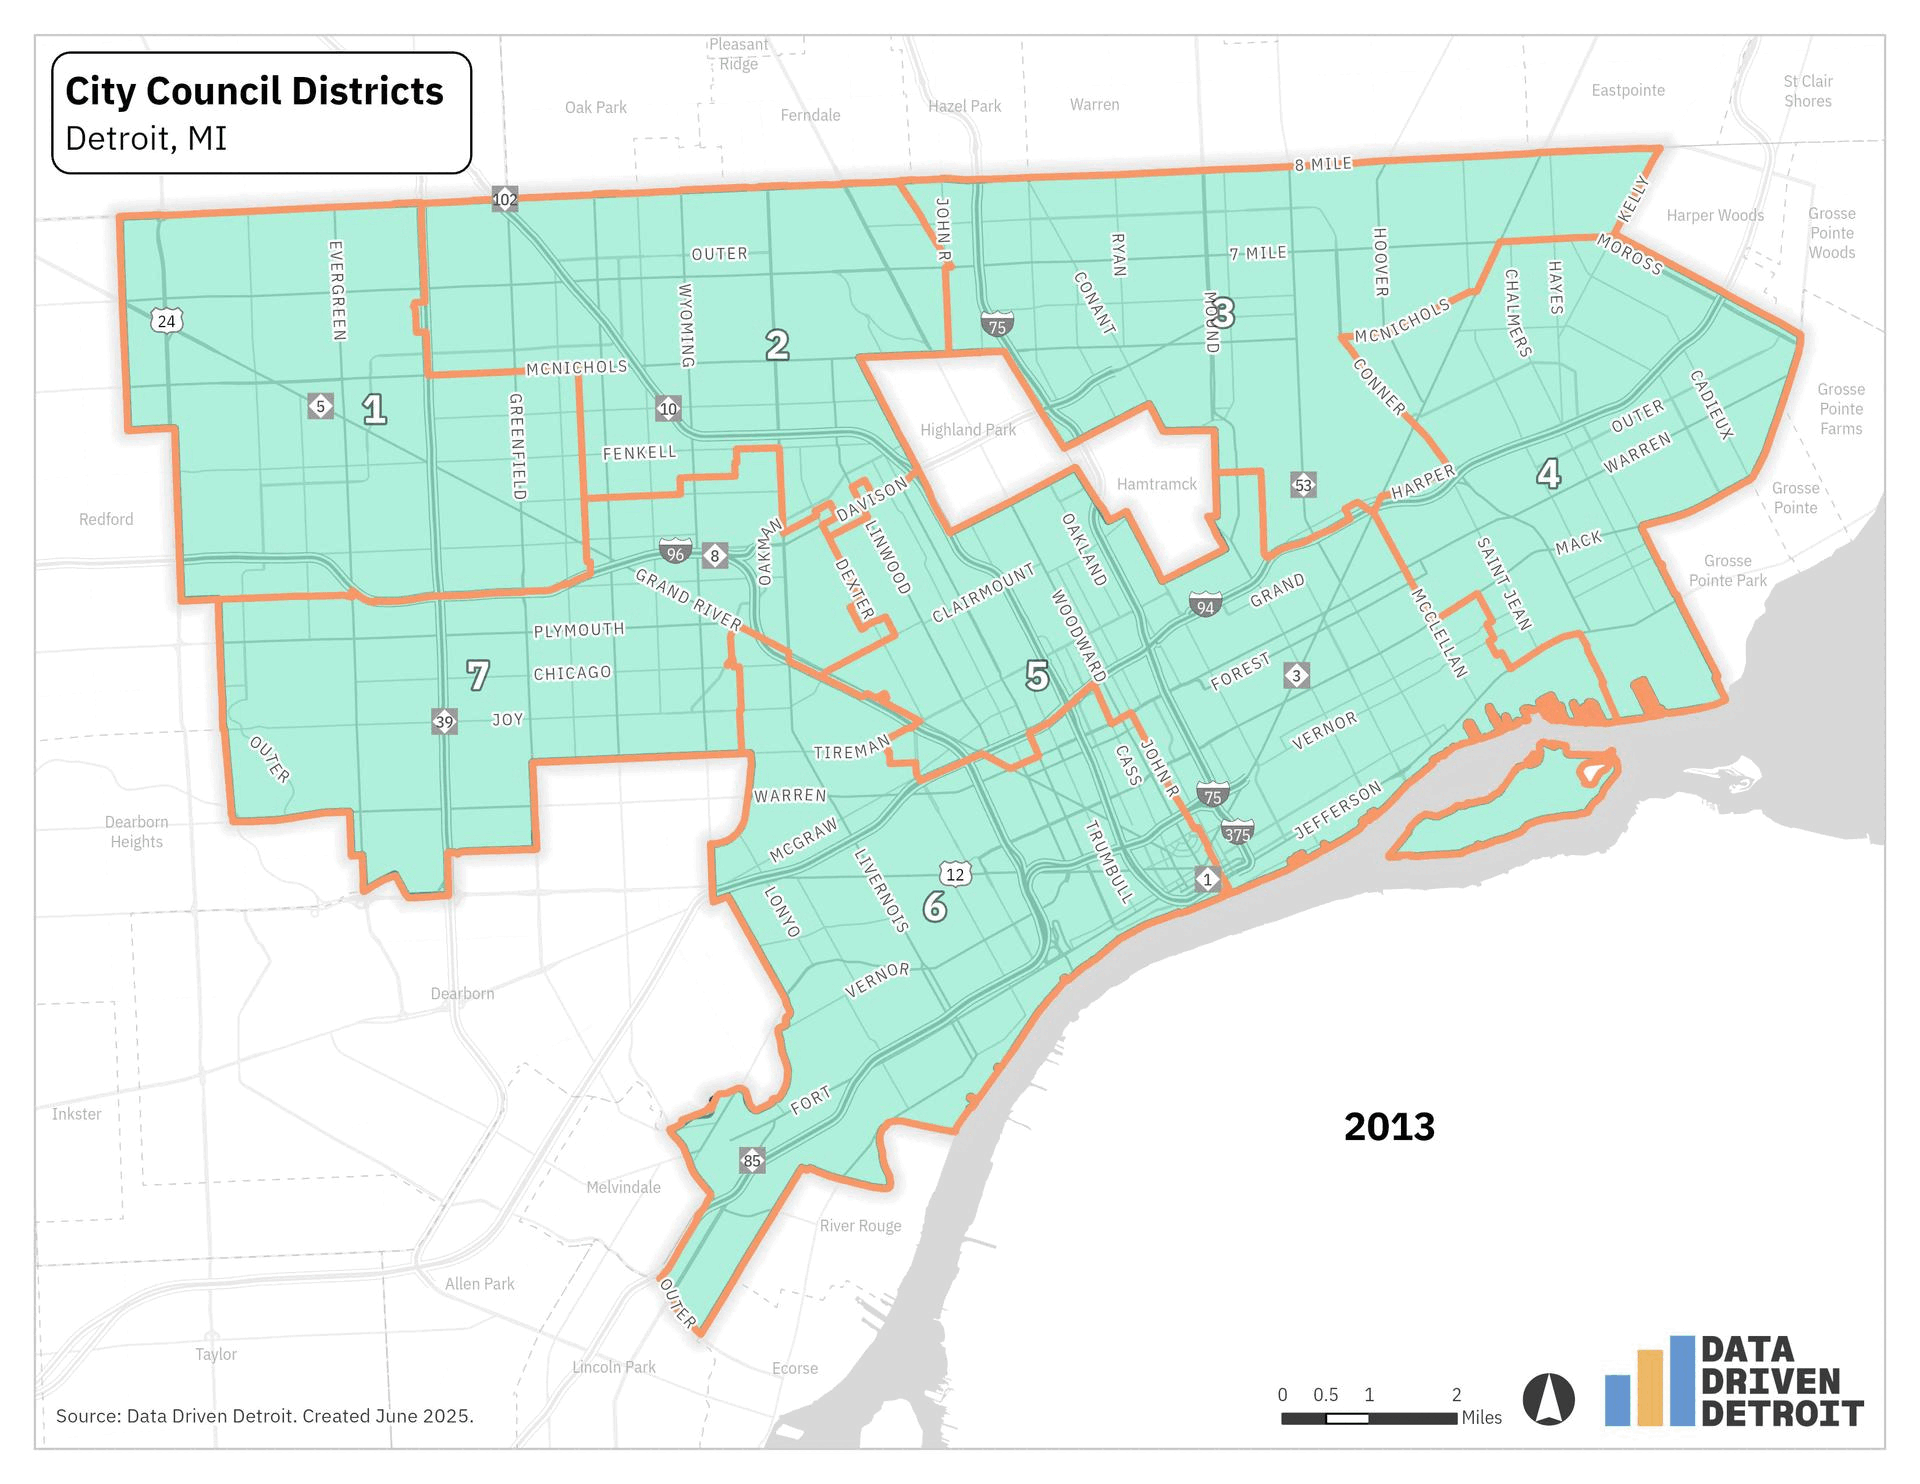
In Detroit, City Council Districts are updated every 10 years to reflect population changes following the U.S. Census. This process, called redistricting, ensures each district has roughly equal population, allowing each council member to represent a similar number of constituents. The release of 2020 Census data led to a redraw of the seven Detroit City Council districts. The 2025 election will be the first time these new boundaries are used. You can see the changes are most impactful on neighborhoods south of Hamtramck and west of Highland Park.
These changes affected which district some residents were in, but they also meant that we had to update how we reported neighborhood zones. Prior NVI results were reported for the old council districts. The current data is reported based on the new council districts.
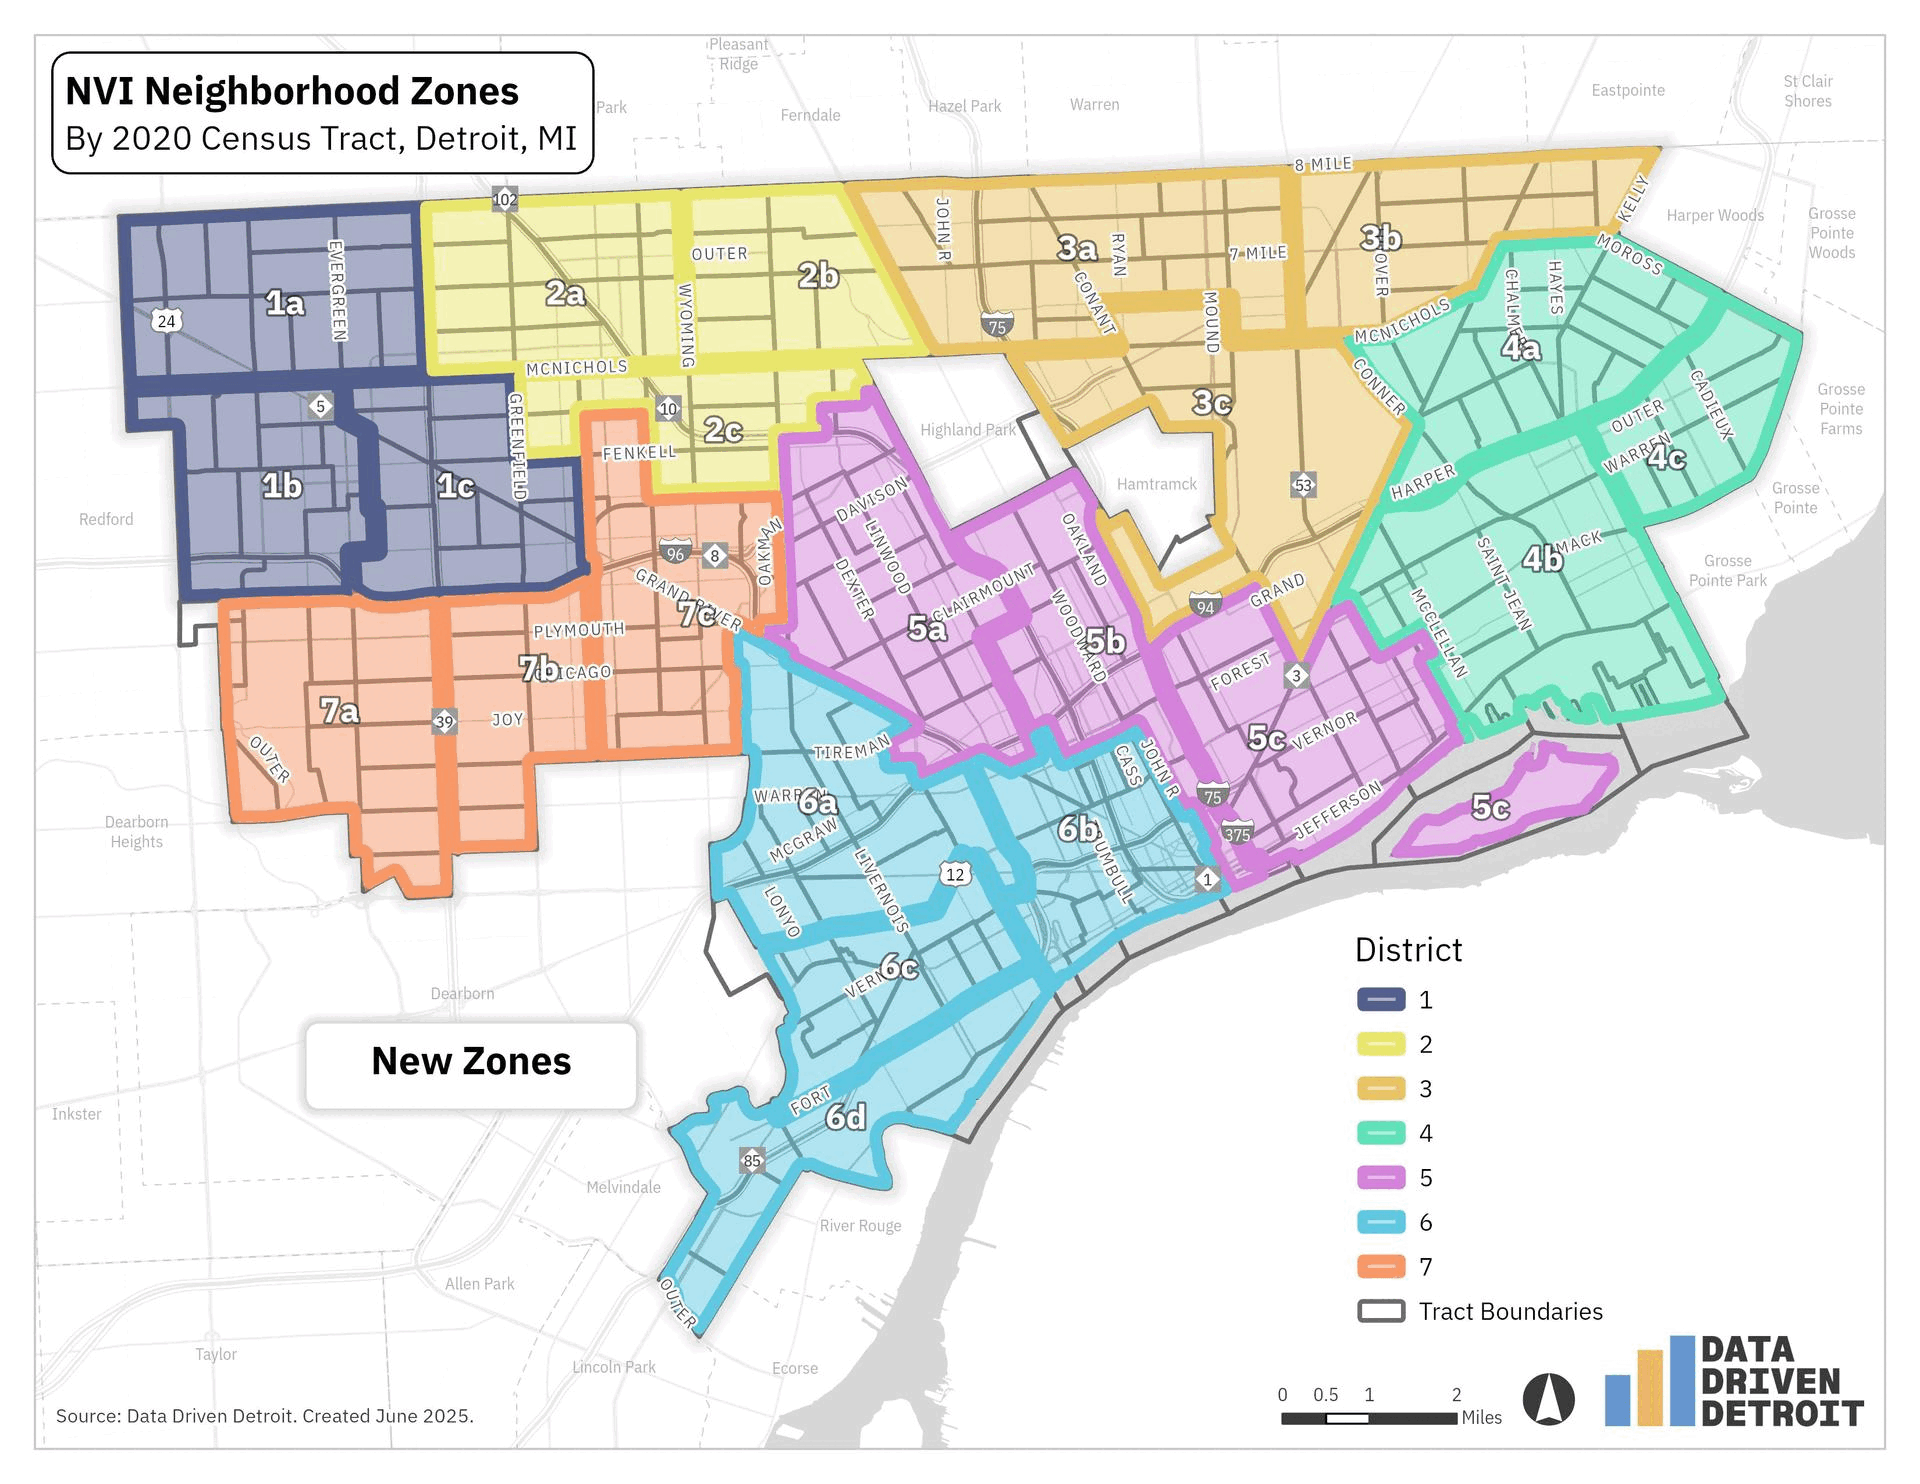
You can see how the neighborhood zones changed within each council district below. Some neighborhood zones remained mostly the same, like the zones in Council District 1. In other council districts, like District 5, all the zones were impacted.
When people take the NVI survey, their address provides a specific point in the city, and with our handy geographic database, we’re able to identify which NVI Neighborhood Zone they live in. The same approach is used for other address-level data in the NVI, for example, building permits or tax foreclosures. We take all the data in that zone and aggregate it, meaning that we take all of the individual data in the neighborhood zone and group it together to get a better understanding of that specific area. How we group it together depends on the data: sometimes we show a range of responses, other times we use an average or median response.
For some NVI data points, we use American Community Survey (ACS) data. This data is not available by address for privacy reasons, so we can’t assign each response to a neighborhood zone like we do with the NVI survey data. Instead, we have to approximate which ACS geography belongs to which neighborhood zone. For NVI, we chose to use census tracts because they have more reliable estimates compared to even smaller geographies. (If you’re curious about what a census tract is, you can explore more about census geographies on State of the Child). Census tract boundaries don’t always align exactly to council district or neighborhood zone boundaries, but we’ve done our best to assign tracts to zones as accurately as possible.
We recognize that neither council districts, nor neighborhood zones, nor census tracts really represent the boundaries that most community development organizations (CDOs) work to serve. As one of the benefits to CDOs promoting the survey to their residents, we offer a special cut of NVI data that matches the CDO’s boundaries. Since the NVI data is collected at the address level, the CDO boundaries are able to be replicated exactly. However, for ACS data, we use the census tracts that align most closely to the CDO’s boundaries. Sometimes this means the data represents a slightly smaller or larger area than the CDO’s service area. This is a limitation of the data we’re working with and we will do our best to help you understand the geographic scope of a dataset with a map highlighting the data boundaries.
Now you know why and how we created NVI Neighborhood Zones. Although it seems like the goal should be to talk to every person in the city, it’s simply not practical given the resources available. The good news is that we can understand information about a large group of people based on sampling a smaller number of people in that area. And while citywide and district-level data are useful for some purposes, reporting data for smaller areas like neighborhood zones can make that data more actionable.